All source code for the website, and the slide PDFs can be found in the talk’s GitHub repository.
Interactive Website
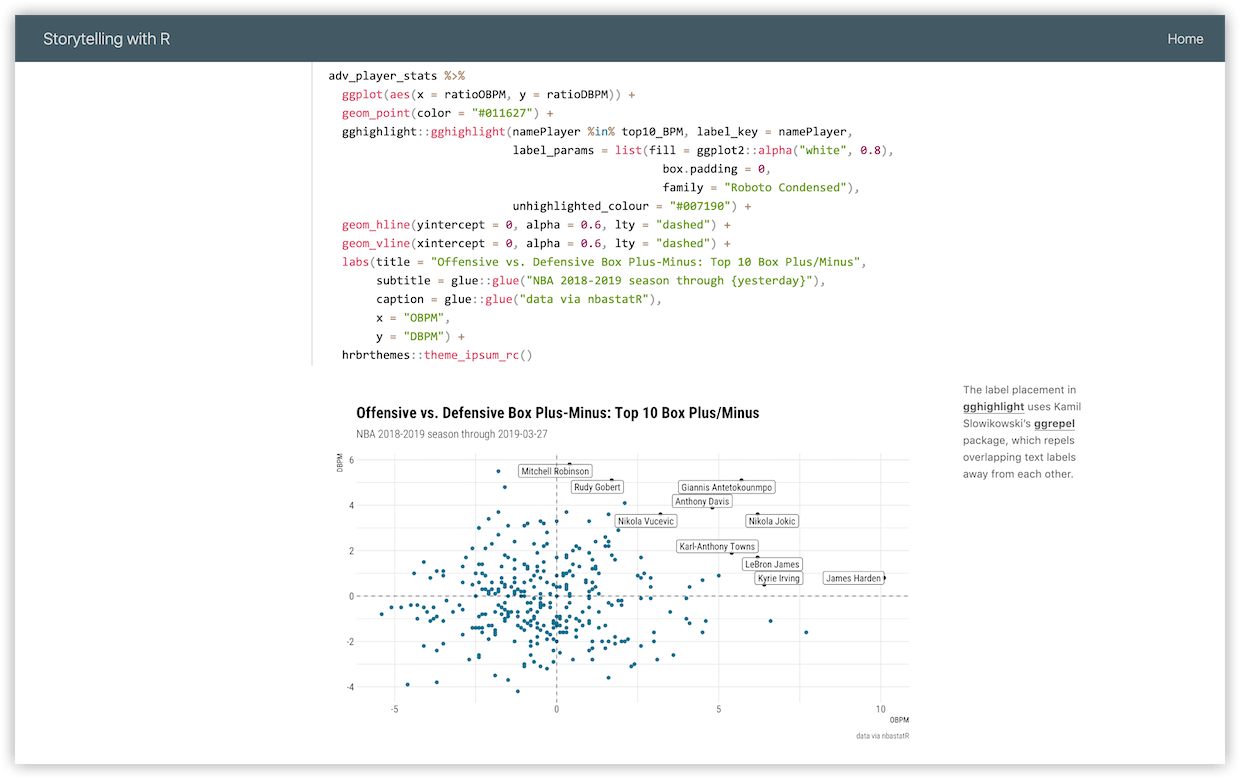
Webpage, Upping your storytelling game…with help from tools that other people already made, features R source code and output for exploratory data analysis, data visualization, and presentation. It features R packages including: skimr (Waring et al. 2022), ggplot2 (Wickham 2016), hrbrthemes (Rudis 2020), gghighlight (Yutani 2023), ggrepel (Slowikowski 2024), gt (Iannone et al. 2024), nbastatR (Bresler 2023), highcharter (Kunst 2024), and gglabeller (Schep 2022).
Slides
PDF of slides.
References
Iannone, Richard, Joe Cheng, Barret Schloerke, Ellis Hughes, Alexandra Lauer, and JooYoung Seo. 2024. gt: Easily create presentation-ready display tables. https://CRAN.R-project.org/package=gt.
Kunst, Joshua. 2024. highcharter: A wrapper for the ’highcharts’ library.
Rudis, Bob. 2020. hrbrthemes: Additional themes, theme components and utilities for ’ggplot2’. http://github.com/hrbrmstr/hrbrthemes.
Schep, Alicia. 2022. gglabeller: Shiny gadget for labelling points in ggplots.
Slowikowski, Kamil. 2024. ggrepel: Automatically position non-overlapping text labels with ’ggplot2’. https://CRAN.R-project.org/package=ggrepel.
Waring, Elin, Michael Quinn, Amelia McNamara, Eduardo Arino de la Rubia, Hao Zhu, and Shannon Ellis. 2022. skimr: Compact and flexible summaries of data. https://CRAN.R-project.org/package=skimr.
Wickham, Hadley. 2016. ggplot2: Elegant graphics for data analysis. Springer-Verlag New York. https://ggplot2.tidyverse.org.
Yutani, Hiroaki. 2023. gghighlight: Highlight lines and points in ’ggplot2’. https://CRAN.R-project.org/package=gghighlight.
Reuse
Citation
BibTeX citation:
@online{averick2019,
  author = {Averick, Mara},
  title = {Storytelling with {R}},
  date = {2019-03-28},
  url = {https://dataand.me/talks/2019-03_storytelling-with-r/},
  langid = {en-US}
}
For attribution, please cite this work as:
Averick, Mara. 2019. “Storytelling with R.” March 28, 2019.
https://dataand.me/talks/2019-03_storytelling-with-r/.