Home
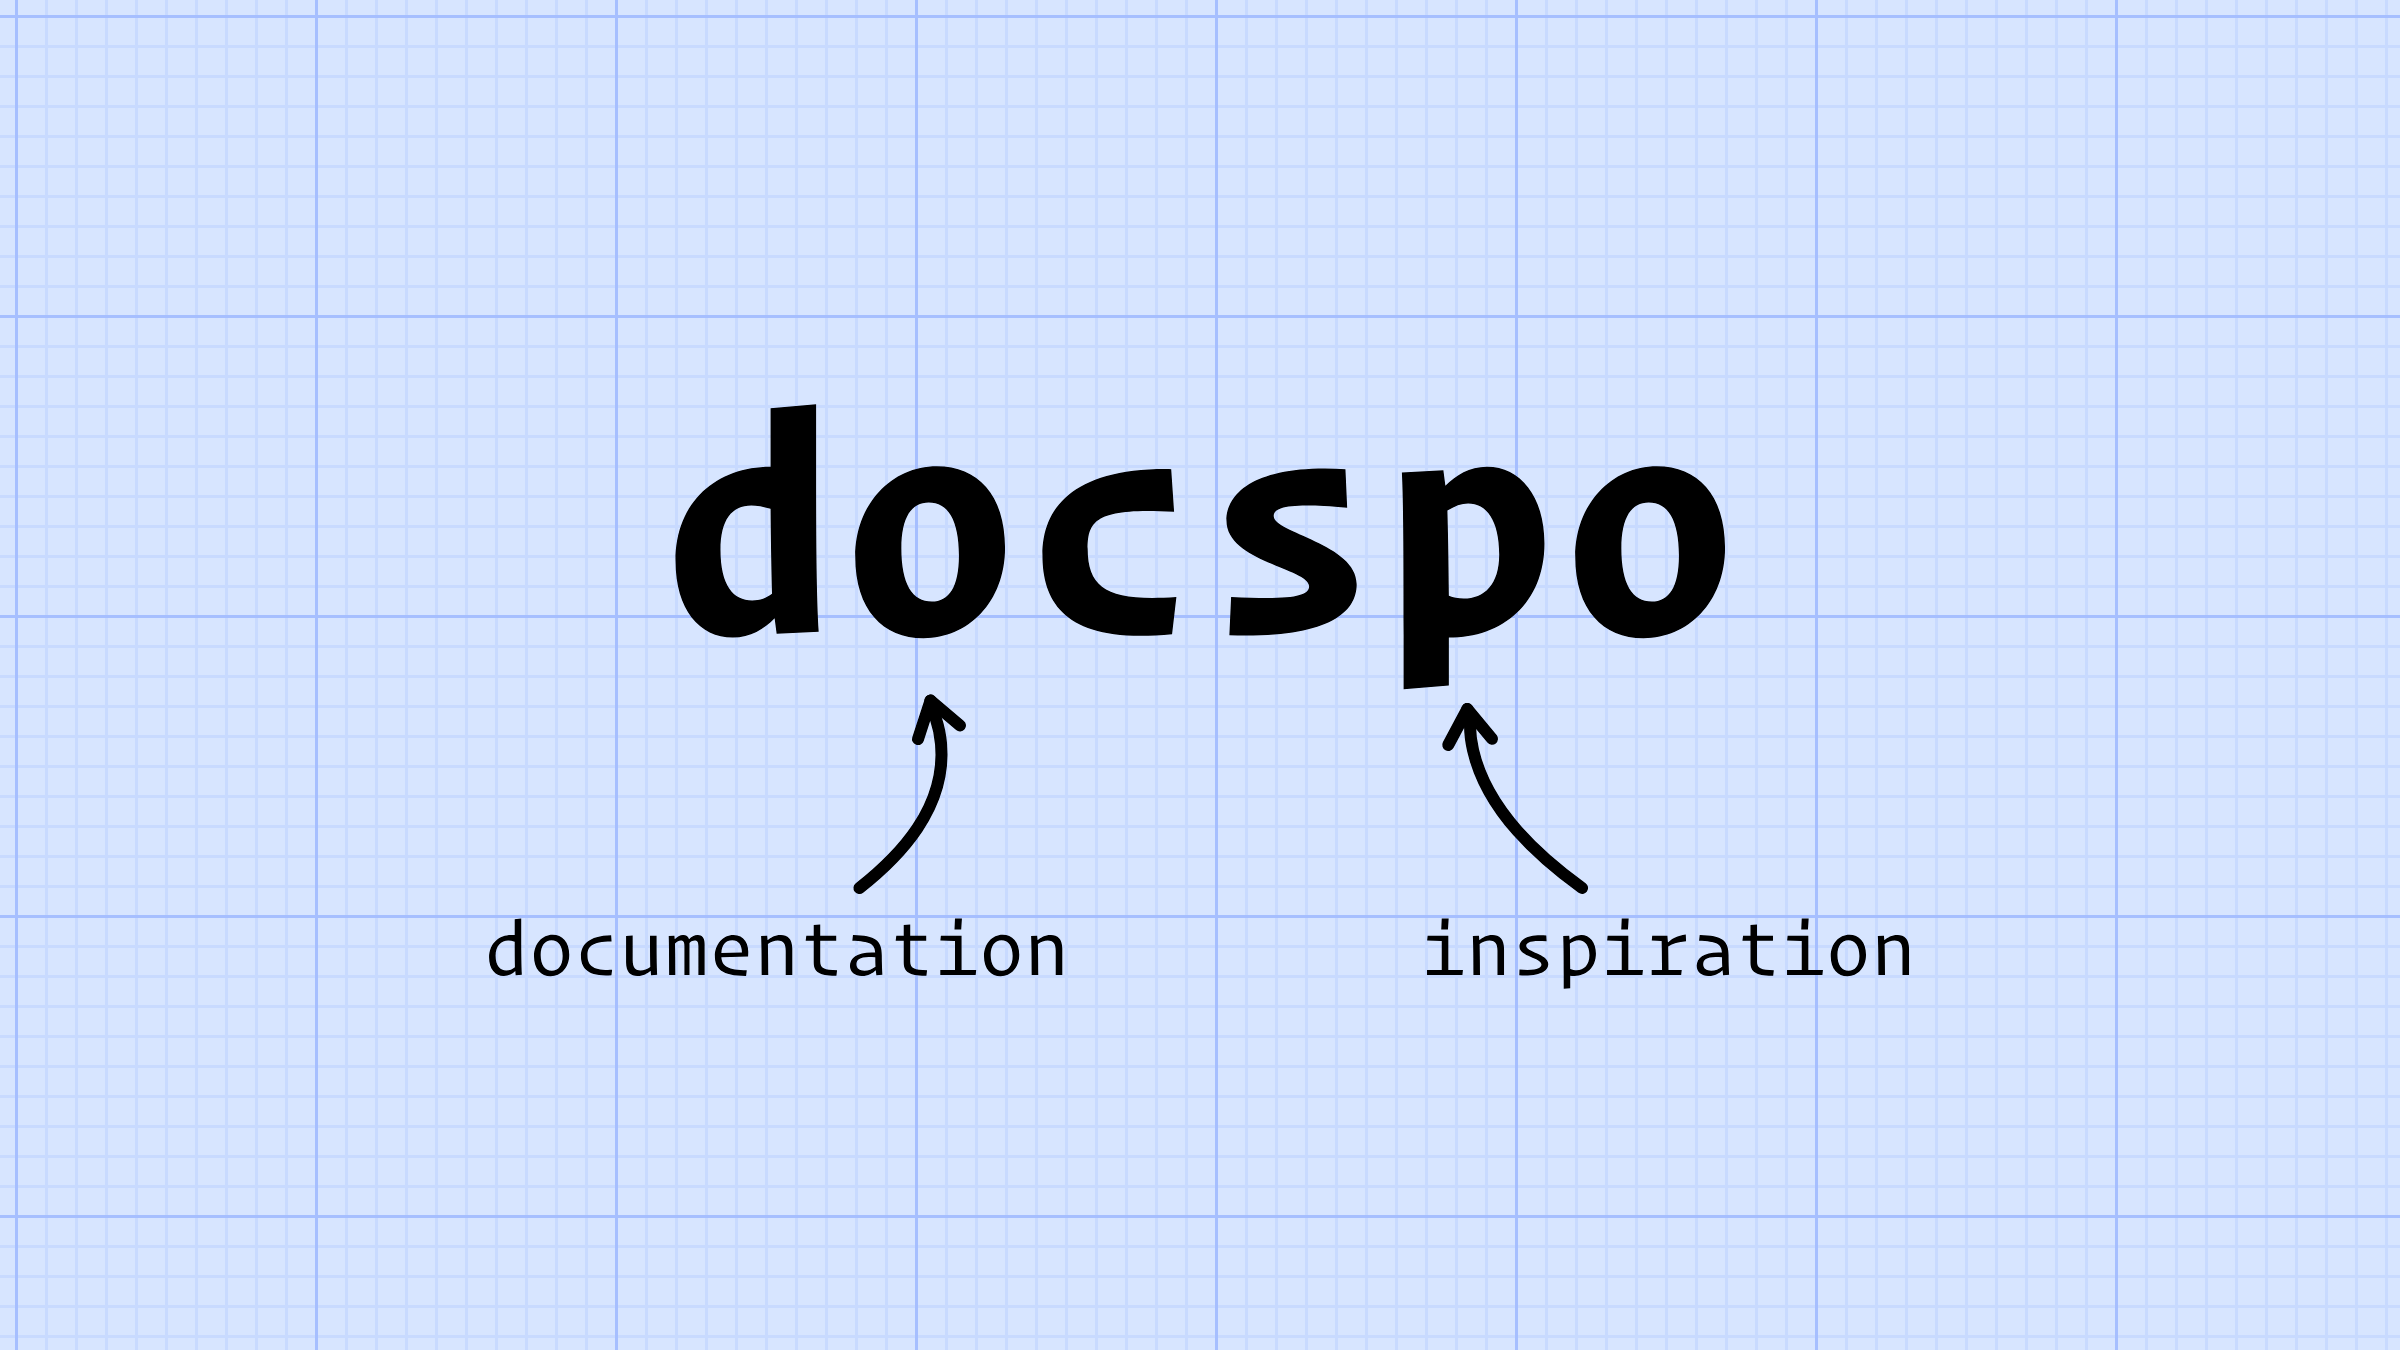
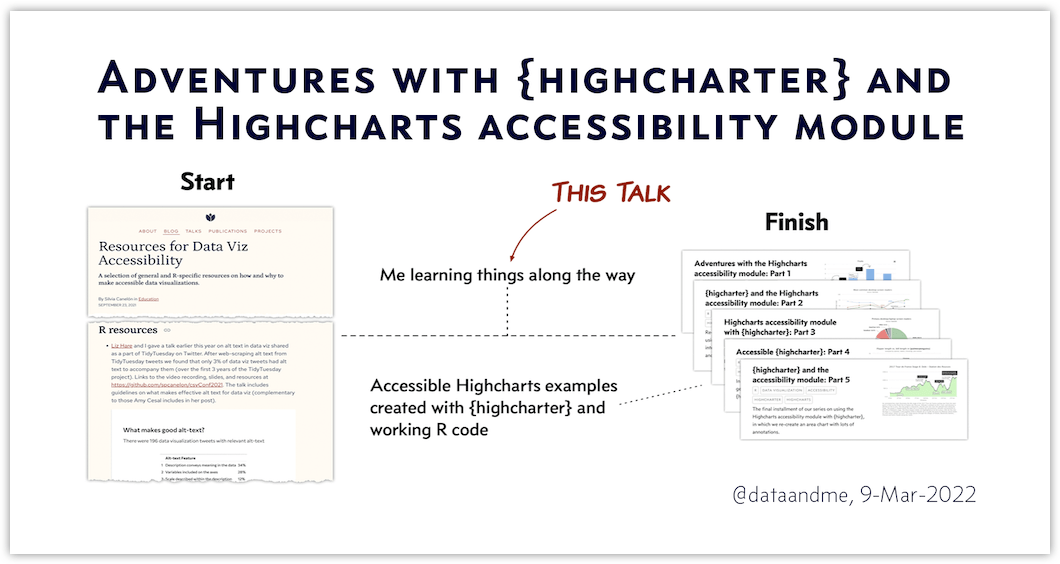
highcharter a11y talk
talks
video
R
data visualization
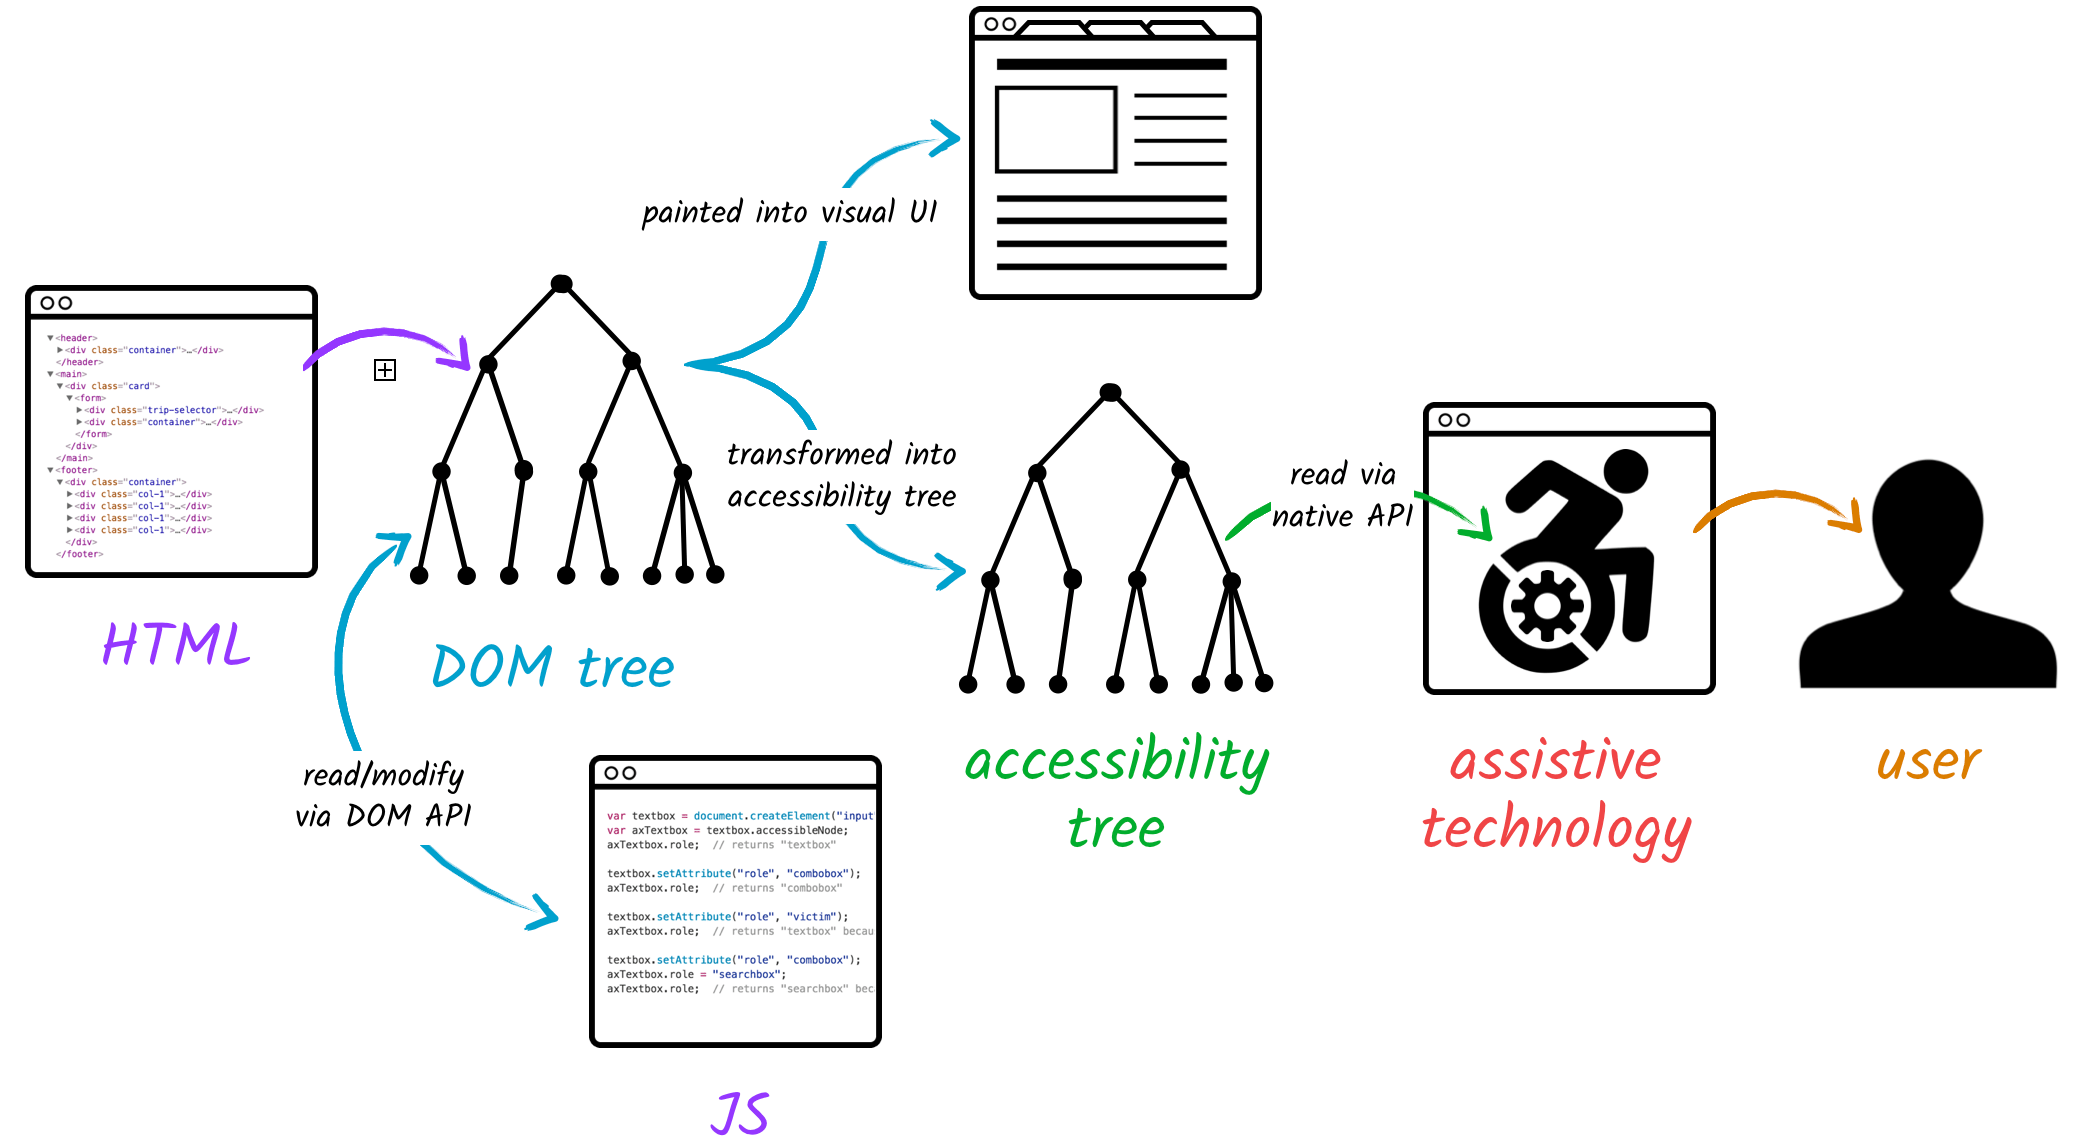
accessibility
Highcharts
highcharter
Down the front-end rabbit hole
notes
Quarto
Sass
SCSS
Bootstrap
CSS Grid

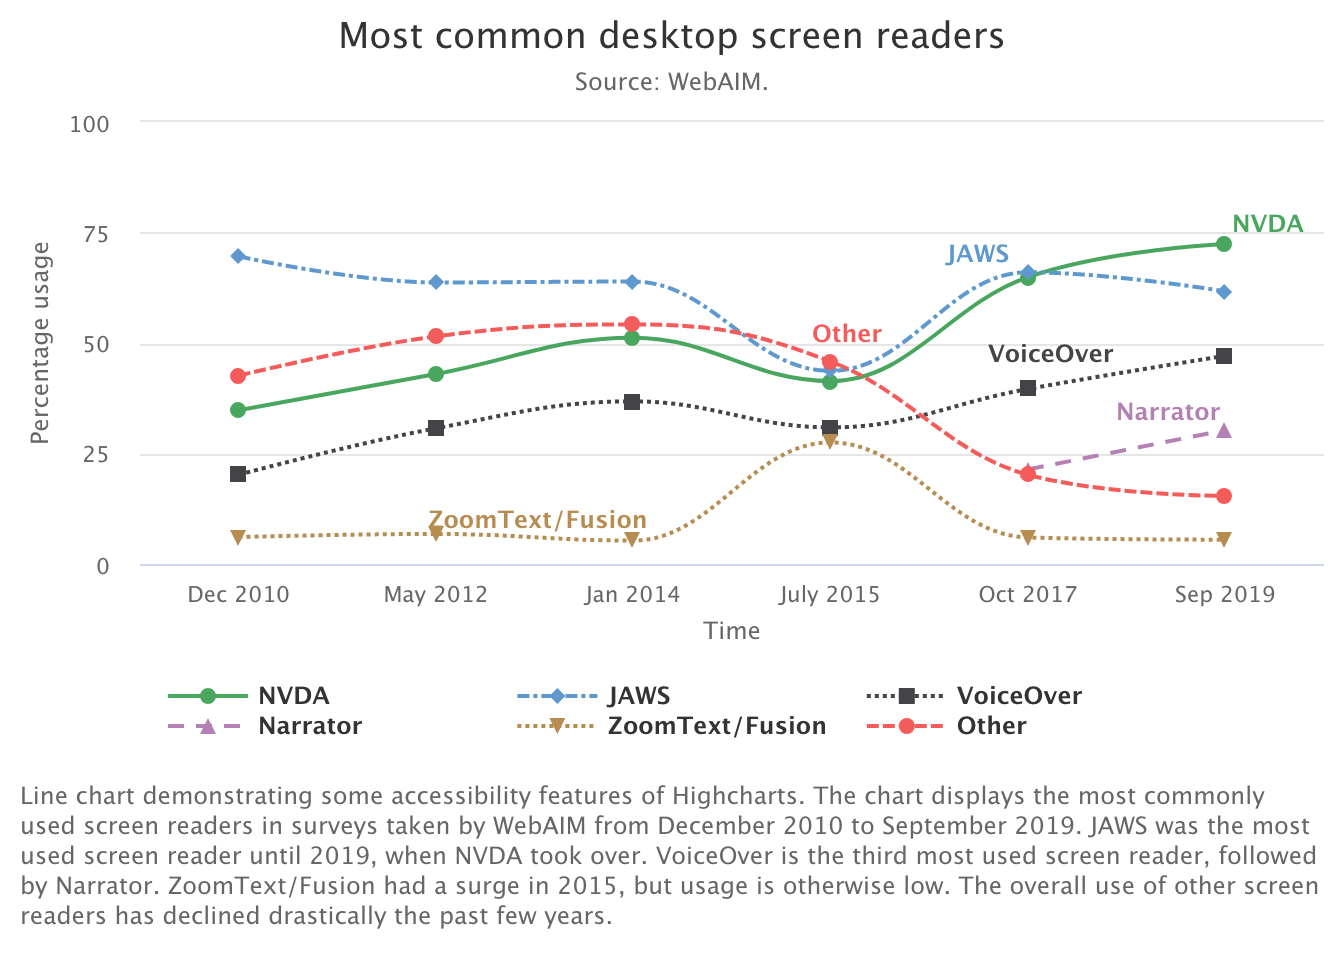
{highcharter} and the accessibility module: Part 5
R
data visualization
accessibility
highcharter
Highcharts
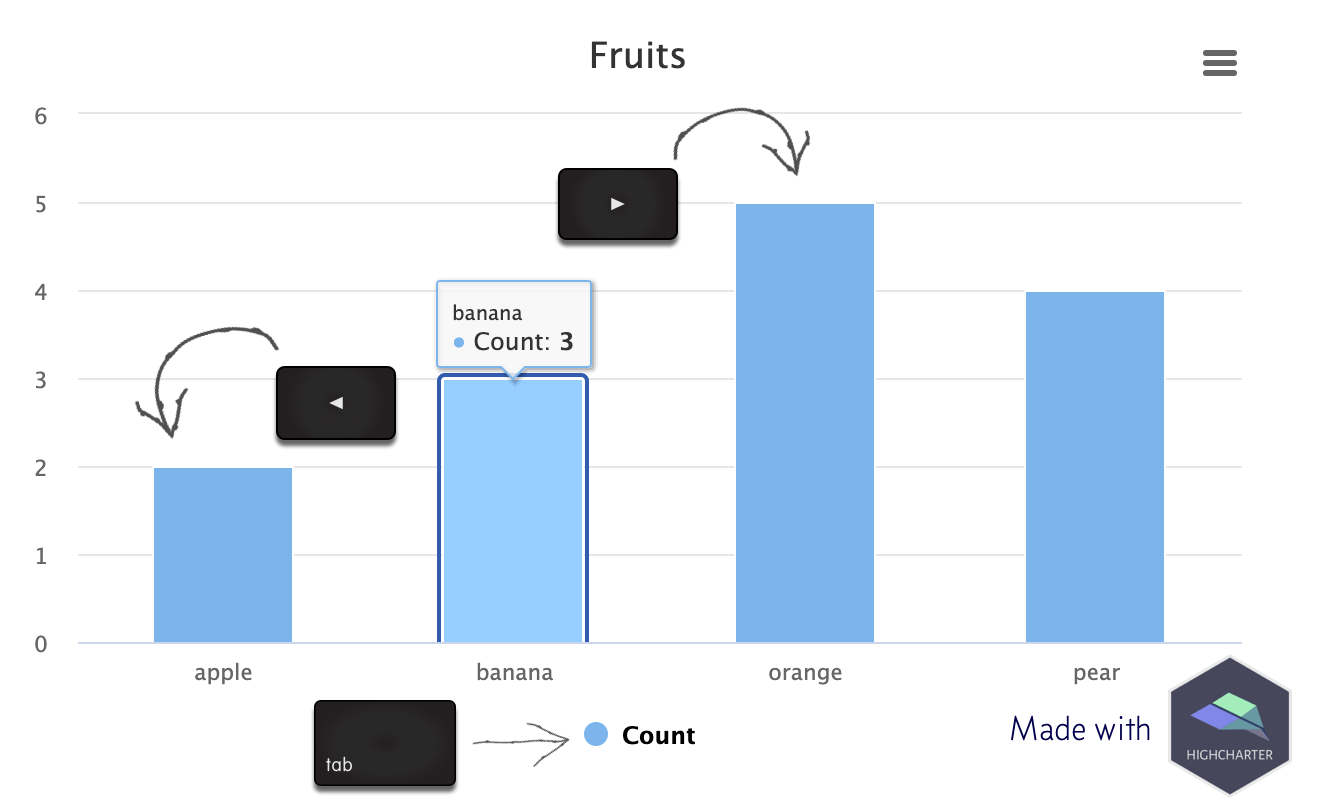
Accessible {highcharter}: Part 4
R
data visualization
accessibility
highcharter
Highcharts
Highcharts accessibility module with {highcharter}: Part 3
R
data visualization
accessibility
highcharter
Highcharts
{higcharter} and the Highcharts accessibility module: Part 2
R
data visualization
accessibility
highcharter
Highcharts
Adventures with the Highcharts accessibility module: Part 1
R
data visualization
accessibility
highcharter
Highcharts


No matching items